Scan Information File (SIF)
What is SIF data
SIF contains the PET frame start and end times, and the numbers of observed events during each time frame.
SIF data is stored in an ASCII text file. This is an example of a SIF data:
4/12/2002 18:11:32  28 4 1 B04946 C-11
      0      60       125296       119001
     60      75       637313       269790
     75      80      1031361       299114
     80      90      3196802      1001146
     90     100      4401745      1349903
...
Title line contains the following information:
- Scan start time
- Number of frames
- Number of columns in SIF data
- SIF version (in this case 1)
- Study id (study number)
- Isotope that was used to label the PET tracer
Each data line contains the following columns:
- Frame start time (s)
- Frame end time (s)
- Number of prompts
- Number of random events
Why is SIF needed
Calculating fit weights for analysis models
SIF data can be used or is required in calculating weights for model fits. SIF data is required e.g. when applying simplified reference tissue model with basis function approach (imgbfbp). Weights can be added into regional datafiles using dftweigh.
Storing PET frame times with Analyze image format
Analyze image format does not contain information on PET frame times, therefore dynamic Analyze images should always be accompanied by SIF data.
Storing tracer label isotope with Analyze image format
Analyze image format does not contain information on the isotope or its half-life, therefore dynamic Analyze images should always be accompanied by SIF data. If SIF does not either contain isotope, it can be added to SIF files using sifisot.
Where does SIF data come from
From PET scanners
GE Advance
In Turku PET Centre, SIF data is extracted together with ECAT 6.3 images from GE Advance database, and written in the same directory as the PET image with extension .sif.
HR+
SIF data can be extracted from HR+ scan data (*.s) using hrp2sif.
Siemens Inveon small-animal PET/CT
SIF data can be extracted from original image header files (*.hdr) using upet2sif.
From dynamic PET image
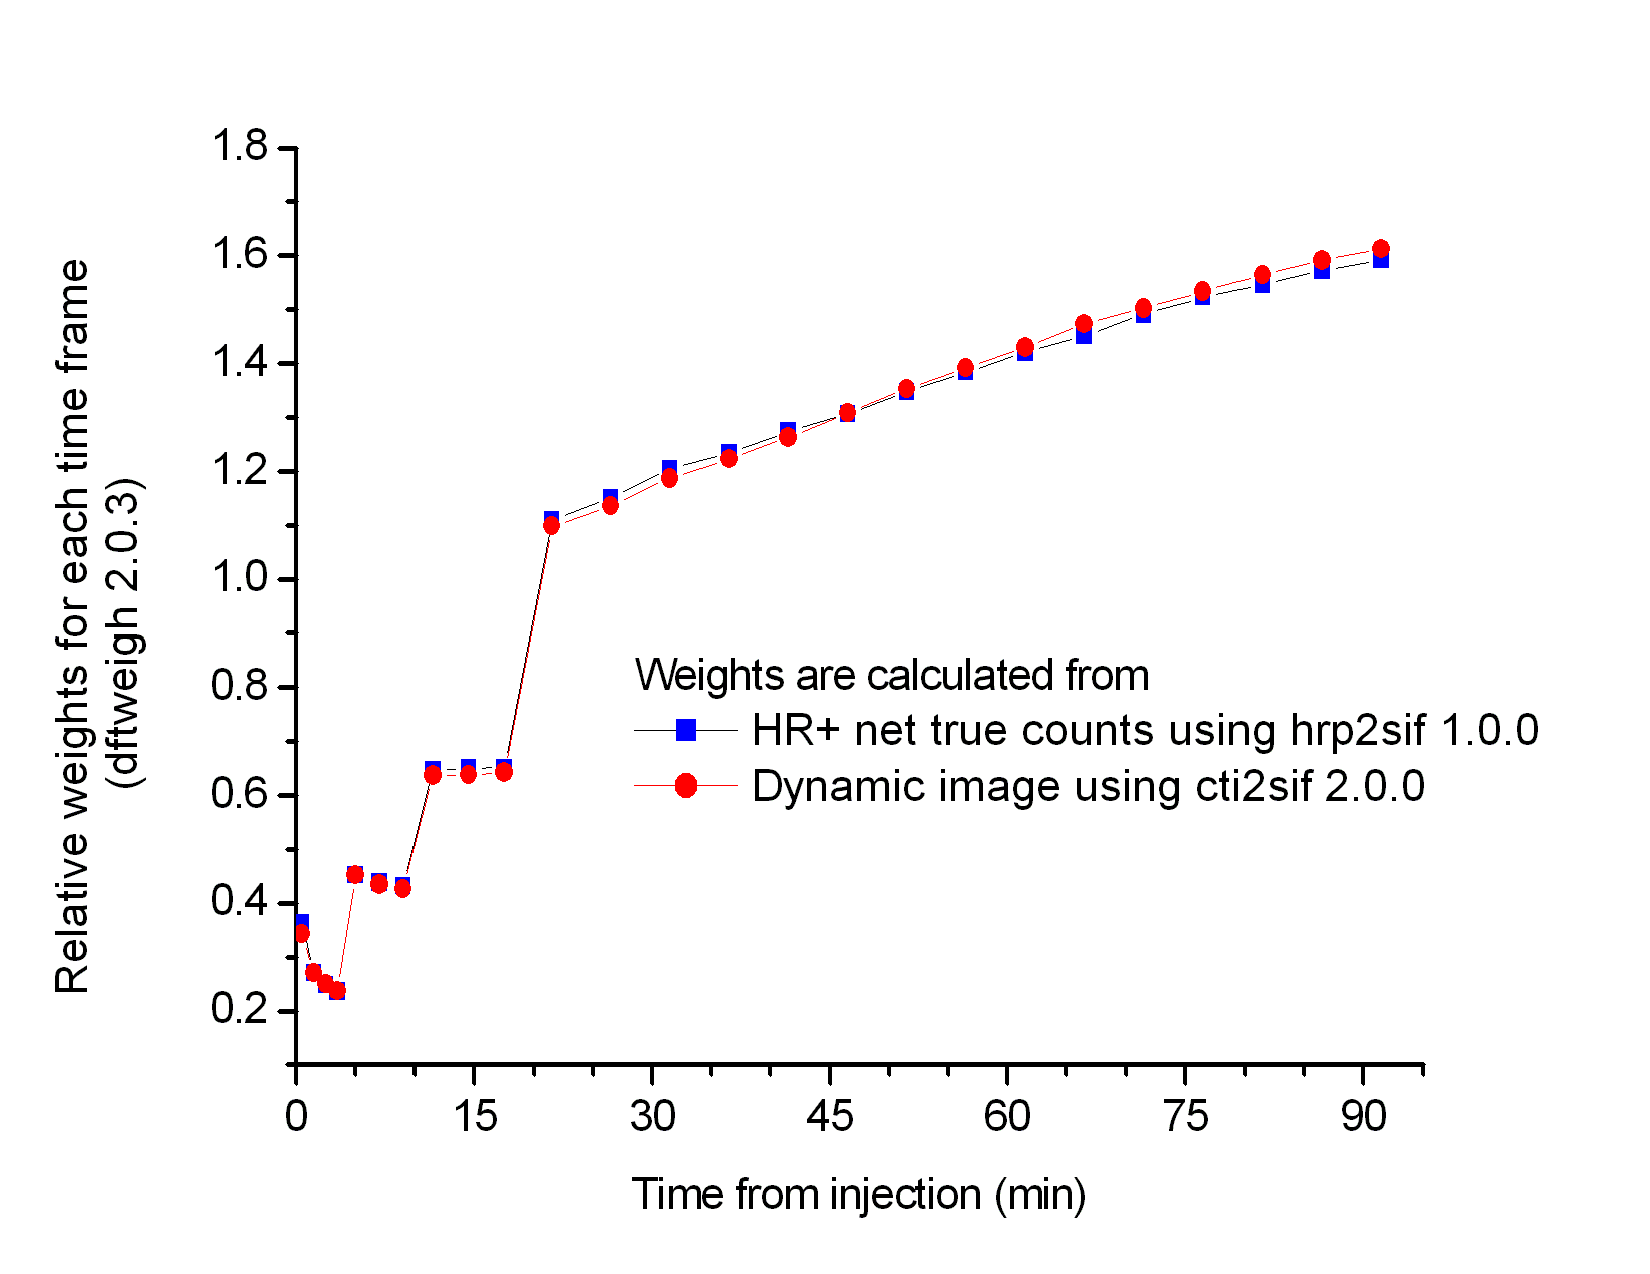
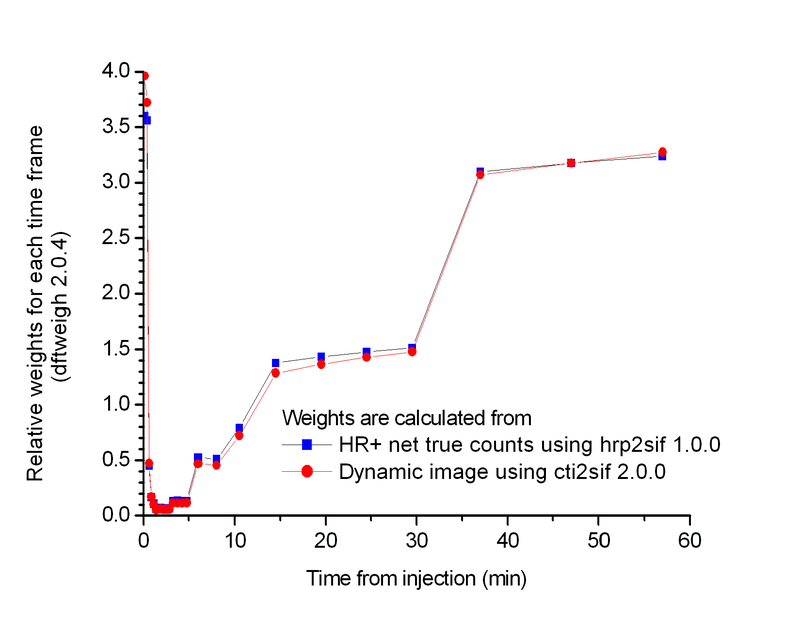
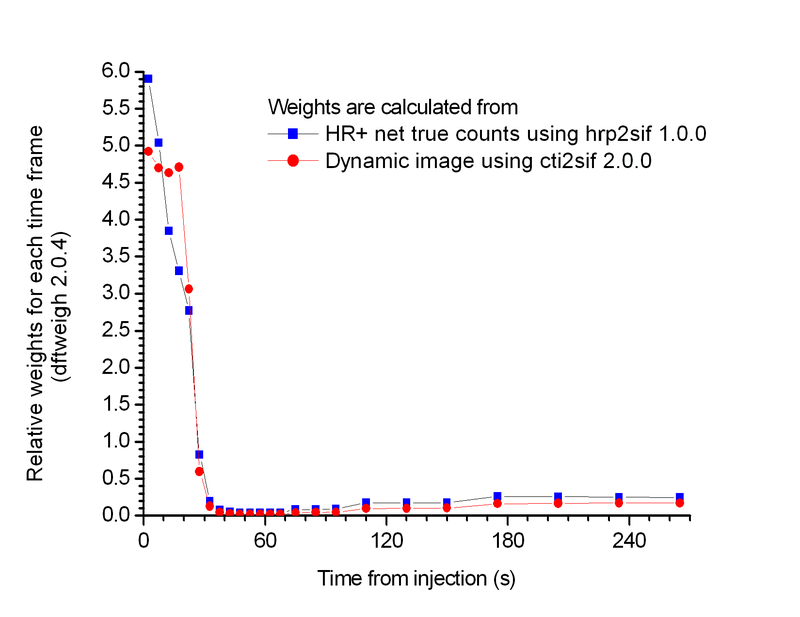
If SIF data is not available, for most purposes it is enough to produce it from dynamic ECAT 6.3 or ECAT 7 images using eframe or cti2sif. As examples, below are graphs of fit weight factors calculated from net true counts and from average radioactivity concentration in the dynamic image:
Brain [18F]FDOPA study scanned with HR+:
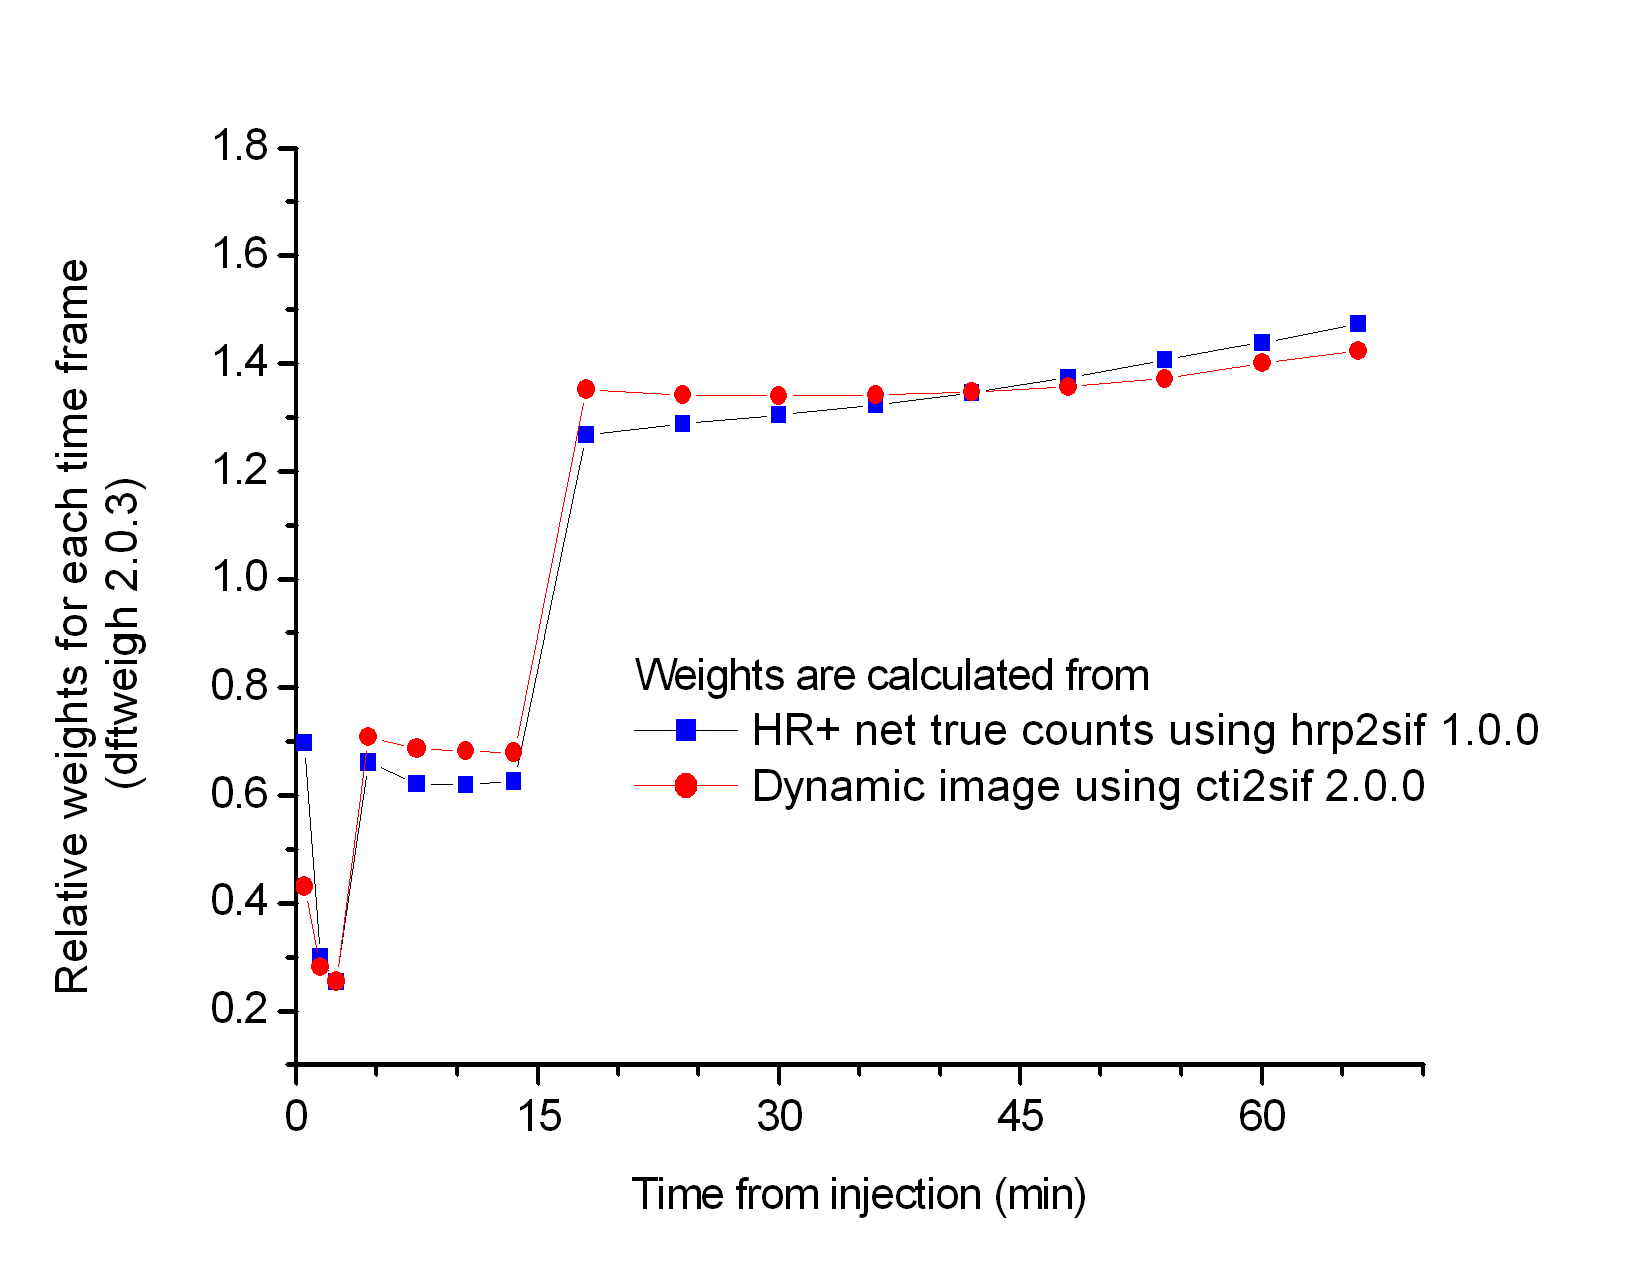
Brain [11C]FLB study scanned with HR+:
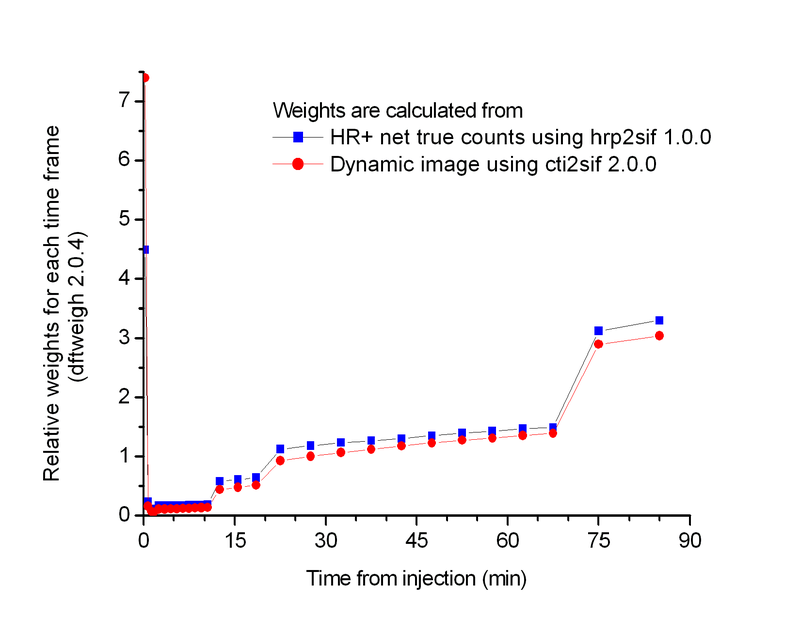
Brain [11C]PIB study scanned with HR+:
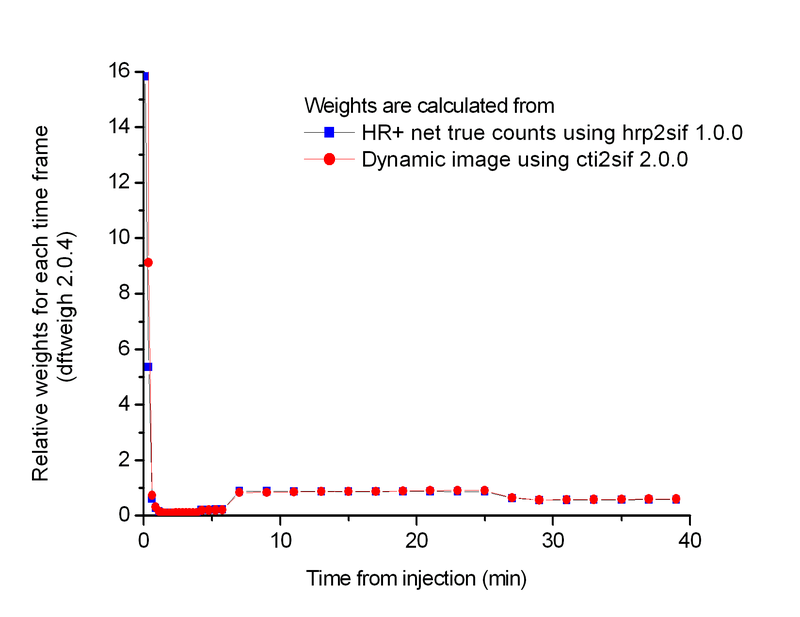
Myocardial [11C]HED study scanned in 2D with HR+:
Myocardial [18F]FDG study scanned in 2D with HR+:
Myocardial [15O]H2O study scanned in 2D with HR+:
From regional PET curves
If absolutely necessary, the SIF files can also be made from regional PET data using dftweigh with option -sif=filename.
Software for processing SIF data
- Creating SIF data from any dynamic PET image or sinogram, or specifically from dynamic HR+ sinogram
- Viewing the SIF data
- Catenating SIF data from interrupted PET scans
- Adding isotope code to SIF
