Pharmacokinetics from PET plasma curves
This page covers the pharmacokinetics of PET ligand in the plasma, not in tissue, and not the pharmacokinetics or pharmacodynamics of the drug that is studied with PET ligand.
AUC - Area-under-curve
AUC is the area under the plot of radioactivity concentration of authentic (metabolite corrected) PET tracer against time after tracer infusion. The AUC can be used to estimate the total clearance of labelled PET ligands, CIT.
AUC can be determined by the "trapezoidal rule": the data points
are connected by straight line segments, perpendiculars are erected from the
abscissa to each data point, and the sum of the areas of the trapezoids is
computed. This can be done e.g. using program interpol with option
-i.
However, the last measured concentration is usually not zero, sometimes not
even close to zero. Then the AUC form 0 to infinite time must be
estimated using the slope of the end-part of the plot of the natural
logarithm of tracer concentration against time. This can be done e.g. using
program paucinf.
The unit of AUC is the unit of time multiplied by the unit of radioactivity concentration, usually min*kBq/mL.
CIT - Total clearance
The total clearance of PET ligand after a single intravenous dose can be
calculated as
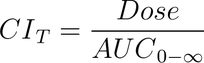
The AUC from 0 to infinite time can be estimated for example with
paucinf.
The unit of clearance depends on the unit of dose, but in principle the unit of radioactivity is cancelled out, and thus the unit of clearance will be volume/unit time. Both of the measures, patient dose and AUC, must be specified either as radioactivity (Bq, Ci) or as moles or mass (mol, g). The specific radioactivity (mCi/umol or MBq/umol) can be used to radioactivity-mass conversion.
Another possibility is to fit a sum of three exponentials to the (protein-free) plasma data and calculate the clearance from the fitted parameters (Abi-Dargham et al., 1994).
kel - Elimination rate constant
When the natural logarithm of tracer concentration is plotted against time
from bolus infusion, the plot becomes linear in the end phase, as the tracer
is eliminated according to the laws of first-order reaction kinetics;
linearity should be verified from the plot.
The slope of the linear part of the plot equals -kel.
The kel can be estimated e.g. using program paucinf.
t1/2 - Half-life of the PET ligand
The amount of time required for the concentration of the PET ligand in
plasma to be halved. This can be applied only if the ligand is eliminated
from the plasma according to the laws of first-order kinetics. It can be
calculated as
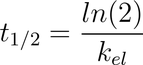
The kel can be estimated e.g. using program paucinf.
This has nothing in common with the physical half-life of positron emitting isotope labels. In pharmacokinetic calculations all curves are corrected for decay, and the curves represent the concentrations of PET ligands, and not concentrations of the radioactive label.
Cmax and Tmax
In principle, the maximal concentration of PET tracer in plasma (Cmax) and the time of maximum concentration (Tmax) could be determined from plasma TAC directly, or after fitting a function to plasma TAC. However, these parameters would be dependent on the injected dose and the bolus infusion protocol, and thus less useful than kel or t1/2.
