Calculation of Logan plot for regional TACs with plasma input
Multiple-time graphical analysis (MTGA) for tracers with reversible uptake (Logan plot with plasma input is used to estimate the distribution volume (VT) of the PET tracer. This method is also referred to as plasma reference graphical analysis (PRGA).
If there exists a reference region with no specific binding, the distribution volume ratio (DVR), related to binding potential (BP) can be calculated by dividing the VTs with the VT from reference region.
First step in the analysis the preprocessing of plasma input curve. The procedure is dependent on the tracer and study protocol. Generalized instructions on the preparation of input curves is given here. MTGA is considered to be robust enough not to require (usually) corrections for time delay or vascular volume fraction.
The next analysis steps (drawing ROIs, calculation of regional TACs, and calculation of Logan plot, can all be done in Carimas or PMOD.
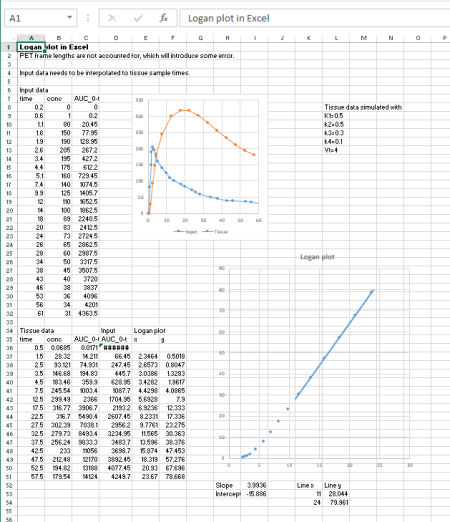
Figure 1. Logan plot is simple to calculate even in Excel. You can download Excel spreadsheets containing simulated data and formulas for Logan plot in two situations: input and tissue data have the same sample times (no interpolation needed), and input and tissue data have different sample times (interpolation required).
If there are more than just a few studies to analyse, then calculation in Excel is too slow and error-prone, and use of Carimas, PMOD, or command-line tools (below) is recommended.
Command-line software
As an alternative to Carimas, Logan plot can also be calculated using in-house command-line tools:
2. Preparation of regional tissue TAC data
Save the regional TAC files in the image analysis program, in DFT format with Carimas, or in TAC format in PMOD. Calculate averages over planes and regions if needed.
3. Computing the volume of distribution
The logan program can then be run with (at least) the following command-line parameters:
- regional tissue TAC file
- file name of (metabolite corrected) plasma TAC
- start time for the line fit (time where linear phase starts)
- end time for the line fit (time where linear phase ends, or end time of study)
- name for result file
Control the linearity of plots
MTGA methods produce correct results only if the slope is calculated from the linear phase of the plot, excluding the curvature in the beginning. You should always draw the Logan plots and control the linearity and quality of the data visually.
Units
The units of VT are (mL plasma)*(mL tissue)-1, if tracer concentration in plasma was given in per volume units (default in TPC), or (g plasma)*(mL tissue)-1, if tracer concentration in plasma was given per gram.
See also:
- Logan plot using reference region input
- Calculation of Logan plot for images
- 1-tissue compartmental model to estimate VT
- 2-tissue compartmental model to estimate VT
- Multilinear method to calculate VT using lhsoldv
Literature
Logan J. Graphical analysis of PET data applied to reversible and irreversible tracers. Nucl Med Biol. 2000; 27:661-670.
Tags: Logan plot, Excel, MTGA, PRGA
Updated at: 2015-01-02
Written by: Vesa Oikonen