Perfusion images using autoradiography and [15O]H2O-PET
Autoradiography (ARG) method for bolus [15O]H2O-PET studies
The methods to measure perfusion (blood flow) with
[15O]H2O (radiowater) are based on the principle of
exchange of inert gas between blood and tissues (Kety 1945).
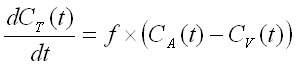
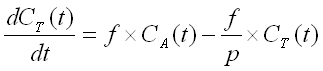
A two compartment (i.e. one tissue compartment) model is used to
describe the kinetics of [15O]H2O (diffusible tracer)
concentration in the tissue, Ct(t), depending on the concentration
in arterial blood, Ca(t), perfusion or blood flow (f), and
the partition coefficient of water, p.
In the ARG method the partition coefficient of water (p, [mL/mL]) between tissue and blood is assumed to be known. Contribution of vascular radioactivity is assumed to be negligible. Blood flow (perfusion) image is computed in units (mL blood)*(dL tissue)-1*min-1.
Calculation of perfusion using ARG method:
Pre-processing of arterial blood curve
Arterial blood data from the on-line sampler needs to be processed before it can be used as input function in the perfusion calculation.
If you are working in TPC, use the script water_input to process the on-line detector (blood pump) data prior to the analysis. It requires the countrate curve (*.cr) or similar data for the time delay correction; please note that in some organs you should not use countrate curve, but a TAC from region-of-interest instead.
The corrected blood TAC should always be check. It often contains close-to-zero values in the end, which should be removed with a text editor, or left out when determining the integration time.
In some occations you can create arterial blood curve from the dynamic PET image. In this case only time delay correction may be neccessary if there is a difference between the blood activity peak and activity peak in the tissue of interest.
Option 1: Analysis with a ready-made script
using graphical user interface
If you are working in TPC, and using Windows XP and MS Explorer, you can click this link imgarg to open a GUI window, fill the required fields, and click "Execute" to compute the perfusion image.
This GUI uses script imgarg.vbs to do the analysis; this script can also be used from command-line.
using command-line interface
If you are working in TPC, and using Windows XP, you can compute the
perfusion image using script
imgarg.vbs.
Open command prompt window, type
cscript P:\bin\windows\imgarg.vbs
followed by the command line parameters as instructed in previous link.
Using this, you can analyse the studies in
batch mode.
This script replaces the UNIX scripts brainflow and neckflow.
Error messages
blood data only upto ... sec.
Blood sampling system introduces considerable delay to the blood before it reaches the online detectors. To be on the safe side, blood sampling should be continued about 60 s after the end of PET scanning. However, sometimes blood sampler has been stopped too soon, leading to this error.
Blood curve can then be extrapolated using extrapol. The resulting extrapolated curve must be checked visually, because extrapolation is based on fitting which may fail, or there may be some another reason for this error.
Option 2: Calculation step-by-step
Alternatively, you can by yourself do the same things that the script does:
1. Compute a look-up table
To compute the look-up table, the following command-line arguments need to be specified to the program arlkup:
- corrected arterial blood datafile that was made in step one
- partition coefficient of water (usually between 0.8 and 1.0)
- maximal blood flow expected to be found in the image, in units (mL blood)*(dL tissue)-1*min-1
- integration start time (sec); usually the time where blood curve starts to rise
- integration duration (sec); the image or sinogram must be integrated over the same time
- size of the look-up table; usually 2000 gives a flow map that is dense enough, 32000 is an absolute maximum because of the applied image file format
- filename for the look-up table
If PET scan was static, i.e., only one time frame was collected, then you
should use option -static=y with arlkup.
If dynamic PET image, corrected for physical decay, was summed into one frame,
this option must not be used, but if dynamic PET image or sinogram,
not corrected for physical decay, was summed, then this option should
be used.
Perfusion studies on GE Advance:
PET scanning is started automatically when the countrate starts to rise. After delay correction, blood curve starts at the same time. Thus, the integration time for look-up table and for image (next step) is easy to set in these studies: start time is 0 and duration is the length of the scan in static imaging or the total lengthof required nr of frames.
2. Integration of the image or sinogram
If the study was dynamic, the quality of the flow image may be better, if frames of the sinogram are summed before image reconstruction. To sum the selected frames of a sinogram use ecatssum.
After the dynamic or static image is available, an integral image must be computed using imginteg, or alternatively, ecatsum with option -i (if the image is dynamic, the frames should be selected so that their total length is the same as the integration time for the blood curve. The frame number and times can be checked witheframe).
3. Conversion of the integral image to the perfusion image
Program ecatlkup is used to convert the integral image to the perfusion image.
The perfusion image can then be used in SPM analysis, or regional flow values can be calculated using e.g. img2dft.
