Pancreatic blood flow using [15O]H2O and dynamic PET
[15O]H2O bolus model
The analysis method of pancreatic blood flow is based on one-tissue compartment model. Measurement of perfusion with[15O]H2O is based on the principle of exchange of inert gas between blood and tissues (Kety and Schmidt, 1945).
Blood flow can be estimated from regional time-activity concentration curves (TACs), or from dynamic PET image to produce perfusion map. The methods presented below use arterial blood curve as their input.
Arterial blood data
Blood data from online sampler
Arterial blood data, collected using on-line sampling system, must be calibrated and corrected for physical decay, dispersion and time delay. It is recommended that regional tissue TAC from pancreas is used for time delay correction.
- Draw ROIs on pancreas. See Figure 1.
- Calculate the tissue TACs from these ROIs. Make sure that TAC datafiles do not contain aortic TACs!
- On MS Windows PC in TPC network, do the corrections for blood data using water_input script. Alternatively, these corrections can also be done using a series of low-level commands on both Solaris and Windows platforms.
- Check visually that the corrected blood TAC is fine and that time delay correction has moved it to start to rise at the same time as the tissue TACs. Previous water_input command made a graph of these curves in postscript format (*.ps). Alternatively you can create the plot by yourself.
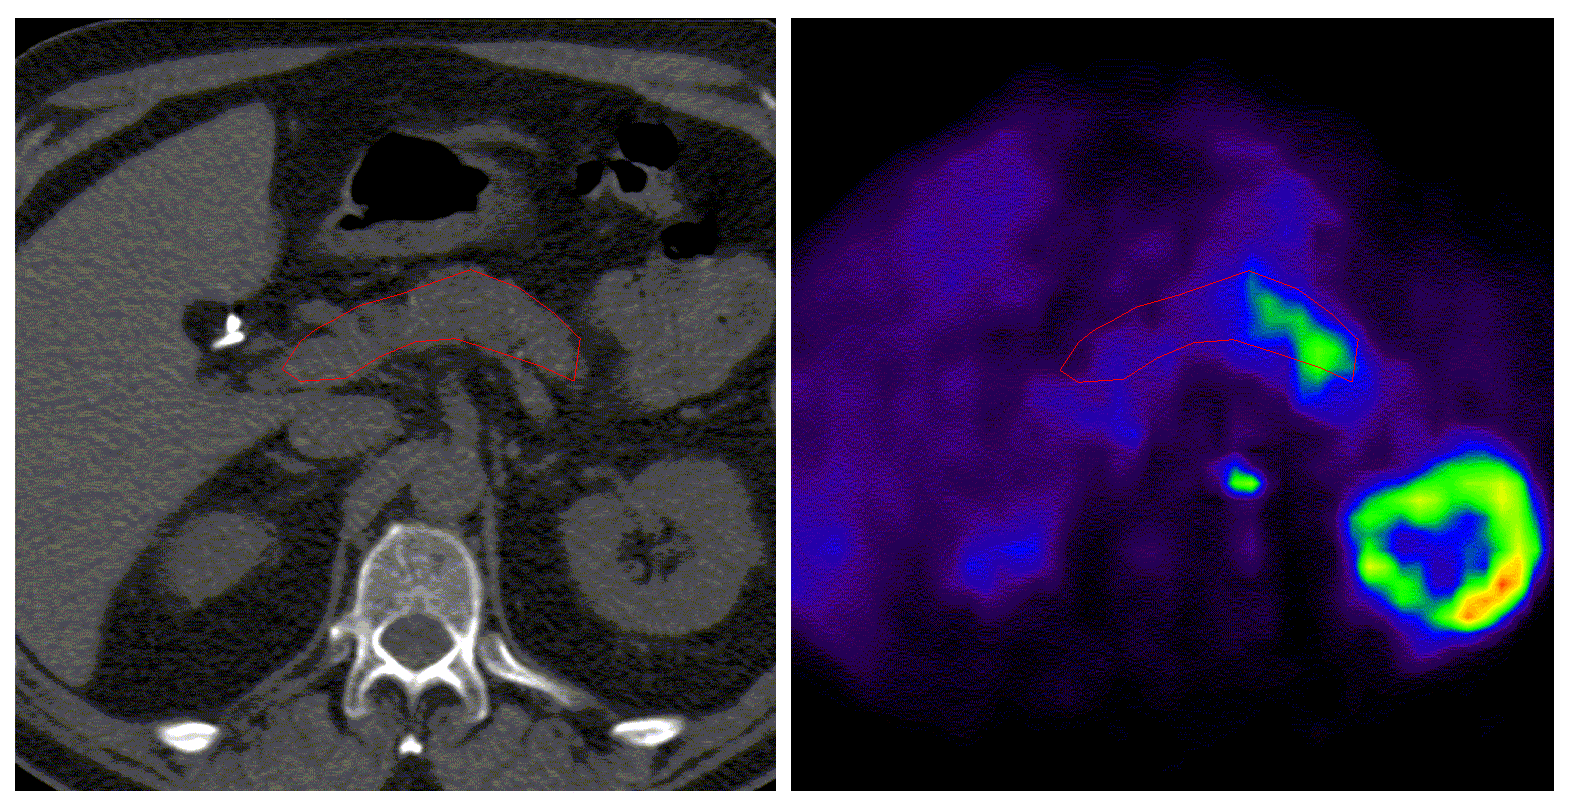 Figure 1. (Click to enlarge)
Extraction of arterial blood data from PET image
Extraction of blood data from PET image is explaned in
Determination of arterial input
function from dynamic PET image.
The procedure is very reliable if CT-images are available and the point spred function
of PET image is known (full width at half maximum FWHM in mm).
If no CT images are available, then the program eabaort may need to be validated
for the specific PET scanner.
Note that DICOM image should be converted to ECAT. See instructions below under
Calculation of flow image.
Delay correction is not needed for input that is extracted from abdominal aorta. It has been verified with several subject's data that the delay time between aorta and pancreas is zero.
Calculation of flow image:
A parametric flow image should be calculated if one is interested in individual flow values in image pixels, not only the regional averages.
- If you have the PET images in DICOM format, convert them to ECAT with
dicom2ecat. Make sure that the frame information is not lost in the conversion (eframe). If it is, then contact Harri Merisaari. - Check that the radioactivity unit is set in the image header. If not, set it.
ecatunit <imagefile>(to check the header)
ecatunit -us=x <imagefile>(to set the unit into header) - Pancreatic blood flow (PBF) image can be calculated using
imgflow, version 0.8.2 or later, in MS Windows command prompt window or Solaris terminal window on SUN or PC platform.For example, if the dynamic PET image filename is us345dy1.img, and the corrected arterial blood curve is us345ab.kbq, you would enter the following command:
imgflow us345ab.kbq us345dy1.img 180 us345bf.img -va=us345bv.img
This command will create a blood flow (BF) image us345bf.img and blood volume (BV) image us345bv.img. Unit of blood flow is [ml blood * min-1 * (ml tissue)-1] by default and unit of BV is [ml blood * (ml tissue)-1]. These parametric images can be processed further as needed.
Calculation of PBF from tissue TACs
If you like to do regional analysis with averaged tissue TAC:s instead of calculating the perfusion for each pixel, you can see e.g. the instructions for renal blood flow (Calculation of RBF from renal TACs).
If one likes to use upper and lower limits for parameters, suitable value for PBF calculation are e.g.:
K1_lower := 0
K1_upper := 300
K1k2_lower := 0
K1k2_upper := 1.23
Va_lower := 0
Va_upper := 30
Delay_lower := 0
Delay_upper := 0
For further assistance, questions or updates contact Kaisa Liukko kaisa.liukko(at)utu.fi.
