Perfusion image using [15O]H2O and dynamic PET
[15O]H2O bolus model
The methods to measure perfusion with [15O]H2O are
based on the principle of exchange of inert gas between blood and tissues
(Kety 1945).
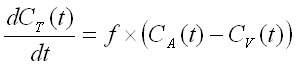
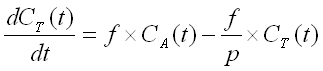
A two compartment (i.e. one tissue compartment) model is used to
describe the kinetics of [15O]H2O (diffusible tracer)
concentration in the tissue, Ct(t), depending on the concentration
in arterial blood, Ca(t), perfusion or blood flow (f), and
the partition coefficient of water, p.
When radioactivity in the volume of interest is measured with PET
(CPET(t)), the
radioactivity of vascular blood inside the
measured volume should also be taken into account;
Va is the arterial volume fraction in tissue:
![]()
Kinetic model vs. autoradiography (ARG) method
ARG method produces persion images that are of better quality (less noise) than images produced by kinetic (dynamic) model, although kinetic technique can also generate reproducible perfusion measurements (de Langen et al., 2008).
ARG method can be applied to static PET images, which reduces the image reconstruction time and file size. However, ARG method requires that the partion coefficient of water is known, and that it is uniform in all regions of interest. Dynamic method also avoids the tendency to underestimate the flow in the presence of flow heterogeneity within a ROI or pixel (Wells et al 2003). Therefore, if precise quantitation is required or partition coefficient is of interest, then dynamic PET imaging and kinetic modeling is recommended.
Calculation of perfusion image:
The following steps can be done in MS Windows command prompt window or Solaris terminal window on SUN or PC platform.
1. Pre-processing of arterial blood curve
Arterial blood data from the on-line sampler needs to be processed before it can be used as input function in the perfusion calculation.
If you are working in TPC, use the script water_input to process the on-line detector (blood pump) data prior to the analysis. It requires the countrate curve (*.cr) or similar data for the time delay correction; please note that in certain organs you should not use countrate curve, but a TAC from region-of-interest instead.
In some occations you can create arterial blood curve from the dynamic PET image. In this case no corrections need to be done.
2. Compute perfusion (blood flow, K1) image
Before calculation
- make sure that both the blood and PET image are in the same calibration units (preferably kBq/ml); image data from HR+ and PET-CT may originally be in units Bq/ml, while blood data are in units kBq/ml.
- if necessary, reduce the noise in dynamic PET image.
Calculation of perfusion image
To compute the K1 image, the following command-line arguments need to be given to the program imgflow:
- corrected arterial blood datafile that was made in step one (times in seconds)
- dynamic [15O]H2O image file
- fit time in seconds
- filename for the perfusion image
The units in the resulting perfusion image are (ml blood)/(min * ml tissue)
by default, but it can be changed to per 100 ml tissue with option -dl.
3. Conversion of perfusion image units
If perfusion is required in units (ml blood)/(min * 100 g tissue), the
perfusion image need to be calculated withimgflow
with options -dl and
-density=1.04 (1.04 g/mL is the density of the brain tissue).
The perfusion image can then be used in SPM analysis, and/or ROIs can be drawn and regional perfusion values calculated as described elsewhere.

Perfusion image of femoral region in an exercise study.
Validation
The results from parametric images should always be validated against results from regional average curves (Lodge et al., 2000). Noise in dynamic image may lead into biased results with distorted variance. Filtering of dynamic images may be needed to achieve the same quantitative results as in the regional analysis. To prevent artefacts and excessive loss of image resolution, the strength of filtering must not exceed the level that is required to achieve comparable results.