Quantification of MAO B activity with
[11C]L-deprenyl-D2 PET
Analysis methods in literature
Analysis method in TPC
Pre-processing plasma input
For a detailed description on the pre-processing of blood data, read the report TPCMOD0033 Appendix A in TPC intranet. Below is a short instruction on how to do the processing withexisting software:
Make sure that you have all the necessary data files:
- On-line sampler data file
- Dynamic PET image file from this study
This file is used to correct for possible start time mismatch between PET and blood sampling. If you are sure that both were started simultaneously, then you do not need the dynamic image file yet. - Count-rate curve
Currently, count-rate curve (*.cr) is not directly produced from PET studies on HR+. Instead, a .r file can be found in the PET image archive. Extract the count-rate curve from this file using tocr
tocr originalfilename.r C-11 yourstudynumber.cr
Alternatively, if extracted count-rate curve can not be used for some reason (for example there is a large initial bump which cannot be removed), it can be replaced by a *.head file that you can create from dynamic PET image using ecathead:
ecathead -m yourdynamicimage.v yourstudynumber.head
- Plasma curve from manual sampling
- Blood curve from manual sampling
- Plasma metabolite data file
Calculate the input TACs
Calculate the DEP-D plasma TAC and total blood TAC, corrected for time delay, using DEP-D_input (version 1.0.0 or later). This step can be done (easily) only when you're logged into TUCH network with a Windows XP computer.
Start the software either from command prompt window with command
dep-d_input
or by clicking the previous link in MS Explorer.
If you wish to create a batch file or provide file names in command line, use
command
cscript P:\bin\windows\DEP-D_input.vbs.
This software will first ask the previously listed file names.
If you are sure that PET scan and blood sampling were started simultaneously,
you do not need to enter the dynamic image file name; when program asks for it,
write None in the file name field instead.
Then the software will ask you to enter file names for the result files: file that will contain the time-delay and plasma metabolite corrected plasma curve, and file that will contain the time-delay corrected total blood curve.
When the calculation is finished, the software will ask you to check the quality of the input data visually from four (4) plots:
- delay correction from the plot of the initial phase of plasma and count-rate curves (*.kbq.delay.ps),
- fit of parent tracer fraction curve (*.rat.ps),
- fit and quality of the blood/plasma curve (*.bprat.ps),
- quality of the resulting plasma and blood curves (*.kbq.ps).
Image processing
PET images are summed over frames, coregistered with MRI and regions are defined as described in detail in quality documents and in study plans.
For regional analysis, TACs are calculated from the dynamic PET image.
Before proceeding, make sure that both the plasma and tissue data are in the same calibration units (preferably kBq/ml) and that the time unit is min. Image data from HR+ and PET-CT may originally be in units Bq/ml.
Regional MAO B activity
Add weights to regional tissue TAC data
Weights should be added to tissue data file using dftweigh. Weights can be calculated based on either SIF file or the average tissue curves. The weights are not absolute, but only relational to each time frame in the TAC.
Estimate two-tissue compartment model parameters
Run the program fitk3, version 3.0.0 or later, with at least the following command-line parameters:
- metabolite corrected plasma TAC file
- blood TAC file
- regional tissue TAC file
- length of study to be used in the fitting (usually a large number to allow fitting to the end of data)
- name for result file; note that an existing result file is overwritten
Because of the relatively large variation in regional estimates for vascular blood volume fraction (Vb), we suggest that its value should be constrained in the fit, for example to 2.7%, that was the population average (n=15) in our centre. This can be done by including option -Vb=2.7 in the fitk3 command-line.
The most reliable model parameter for describing the activity of MAO B is λ*k3, where λ = K1/k2 (independent from perfusion), and k3 is proportional to the association constant kon.
Calculate MAO B inhibition percentage
If two PET studies have been performed for each subject, one before (pre) and one after (post) dosage of a drug that occupies MAO B, the enzyme inhibition percentage (I) can be calculated from the equation:
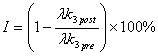
This can be calculated from the result files using resdiff version 1.0.0 or later with option -inhibition. Alternatively, calculation can be done in MS Excel or other spreadsheet program; results can be loaded in easily, if results are pooled and converted to HTML table format withrescoll , version 2.0.0 or later. Also inhibition percentage files can be tabulated with rescoll; do this separately for each group, because also basic statistics (mean, sd, median) are included in the tables.
MAO B activity maps
Fowler and Logan have suggested a method to compute λ*k3 images.
