Regional MTGA for irreversible tracers with plasma input
Theory
Multiple-time graphical analysis (MTGA) for irreversible tracers (Patlak plot, or Gjedde-Patlak plot) with plasma input is used to estimate tracer net uptake (influx) rate, Ki, and possibly also metabolic rate (MR) of glucose or other natural substrate.
Regional Ki calculation
The following steps can be done in MS Windows command prompt window or Solaris terminal window. If you insist on working with the old Sun/Solaris version of Patlak, instructions for that are here.
1. Preparation of arterial plasma curve
The procedure is dependent on the tracer and study protocol. Generalized instructions on the preparation of input curves is given here. In short, if on-line detector was used to collect the blood curve during the early phase of the study, the blood curve must be corrected and converted to plasma TAC, and then combined to the manually sampled plasma curve. Fractions of metabolites must be corrected.
MTGA is considered to be robust enough not to require (usually) corrections for delay or vascular volume fraction.
2. Preparation of regional tissue TAC data
This is explained in detail elsewhere. In short: draw ROIs and calculate regional TACs from dynamic images, and calculate averages over planes and regions if required.
In brain [18F]FDOPA studies with plasma input you must first subtract the reference tissue TAC from the other regional TACs using dftbound.
Myocardial regional data can be corrected for recovery and spillover before calculating Gjedde-Patlak.
3. Computing the net uptake rate (Ki)
The patlak program can then be run with (at least) the following command-line parameters:
- regional tissue TAC file
- filename of (metabolite corrected) plasma TAC
- start time for the line fit (time where linear phase starts)
- end time for the line fit (time where linear phase ends, or end time of study)
- name for result file
Read the more detailed instructions on
patlak usage
by entering command patlak --help.
Control the linearity of plots
MTGA methods produce correct results only if the slope is calculated from the linear phase of the plot, excluding the curvature in the beginning. You should always control the linearity and quality of the data visually.
If only late PET scan is available, then
fractional
uptake rate (FUR, or retention index) can be calculated by assuming
that the y axis intercept in the graphical analysis goes through
zero.
With patlak
the intercept can be set to zero with option
-ic=0, or to a certain population average.
kLOSS
If trapping of the tracer is not completely irreversible during the PET scan the Gjedde-Patlak plot tends to curve downwards in the end. In that case the loss rate (kb or kLOSS) of the tracer from the irreversible compartment to blood can also be estimated, if the loss rate is much smaller than the other parameters of the model [Patlak & Blasberg, 1985], i.e. kLOSS << Ki. However, when any downward curvature in the Gjedde-Patlak plots is observed, it may be more appropriate to select another analysis method designed for reversible uptake.
Downward curvature in Patlak plot may also be caused by systematic errors in plasma measurements, especially in metabolite analysis.
The loss rate kLOSS could be estimated optionally with patlak program versions until 1.7.x, but this option was removed from version 1.8.x.
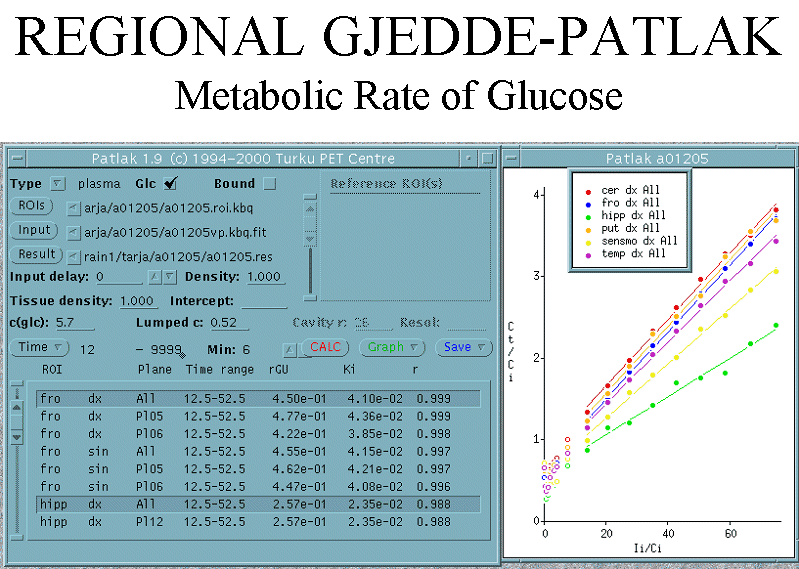
Calculation of metabolic rate from Ki
Metabolic rates could be calculated "manually" from the Ki, for example, by importing Patlak result files into Excel, where Ki values are multiplied by plasma concentration of the native substrate (for example glucose) and divided by lumped constant (LC), and divided by tissue density (g/mL), if results are required per mass of tissue.
Computing Ki and metabolic rate at the same time
Specify the plasma concentration of native substrate,
the lumped constant, and the tissue density on the patlak command-line using
options -Ca, -LC, and -density.
Patlak program then writes both Ki and MR values
in the result file.
Units
The units of Ki are (mL plasma)*(mL tissue)-1*min-1.
LC is unitless. The units of plasma glucose concentration are (usually) mM, which is equal to mmol/L and umol/mL. Therefore, initially, the units of metabolic rate of glucose (glucose consumption) is (µmol glucose)*(mL tissue)-1*min-1. If these results are divided by tissue density, (g tissue)*(mL tissue)-1, and multiplied by 100, the unit is converted to (µmol glucose)*(100 g tissue)-1*min-1, which is the most common unit for tissue glucose consumption in literature.
Steps of Patlak plot calculation using the old SUN program:
1. Preparation of arterial plasma curve
2. Preparation of regional tissue TAC data
This is explained in detail elsewhere. In short: draw ROIs and calculate regional TACs from dynamic images. When you have the regional TACs in DFT format (*.dft), convert those to older *.roi.kbq format using dft2nci.
3. Computing the uptake rate
The Patlak program can be found in the menu of SUN/Solaris workstations:
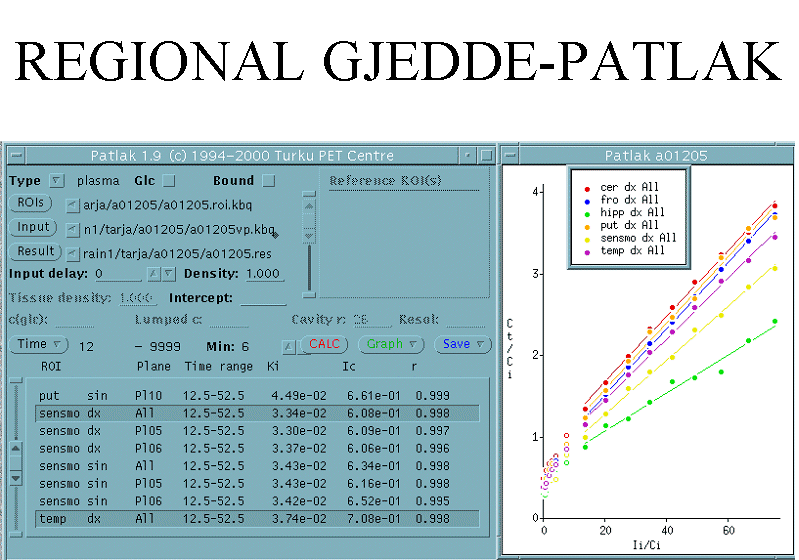
The same program can be used to convert the results directly to glucose consumption, if plasma glucose concentration was measured and lumped constant (LC) is known. This program has also an option for computing myocardial glucose consumption, correcting for recovery and spillover.
